
Co-Simulation
The Co-Simulation menu provides users with various options to facilitate simulation tasks. Below are the options available in this menu:
-
Open/Close Server
-
Use this option to open or close the local WebSocket server dedicated to passive and interactive real-time simulation. WebSockets enable two-way interactive communication sessions between a client application (SimLab VR Viewer or a web client) and a local host (SimLab Composer).
-
-
Export VR Package
-
This option allows you to export the current simulation as a simulation-compatible VR package.
-
-
Simulation Sub-Menu
-
Desktop
-
Simulate in SimLab VR Viewer using desktop mode.
-
-
VR
-
Simulate in SimLab VR Viewer using virtual reality mode (VR headset).
-
-
Start Simulation
-
Initiate the simulation process using the local WebSocket server.
-
-
-
Interactive Sub-Menu
-
Desktop
-
Interact with the simulation in SimLab VR Viewer using desktop mode.
-
-
VR
-
Interact with the simulation in SimLab VR Viewer using virtual reality mode (VR headset).
-
-
Start Simulation
-
Start interactive simulation using the local WebSocket server.
-
-
Interactive Simulation supports pointer devices, sliders, keyboards, and joysticks.
Tutorial for VR Interactive Simulation:
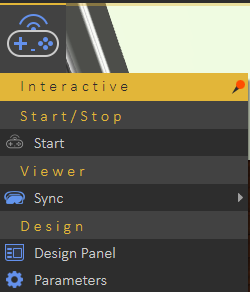
Start/Stop Group
You can start or stop the run of an interactive simulation by clicking over the Start/Stop button (as shown in the following image):
- Start/Stop: Either start or stop Interactive Simulation.
Interactive Simulation supports pointer devices, sliders, keyboards, and joysticks.
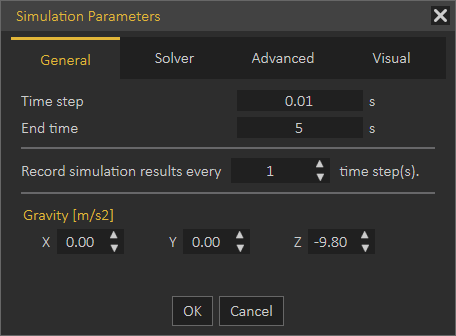
Design Group
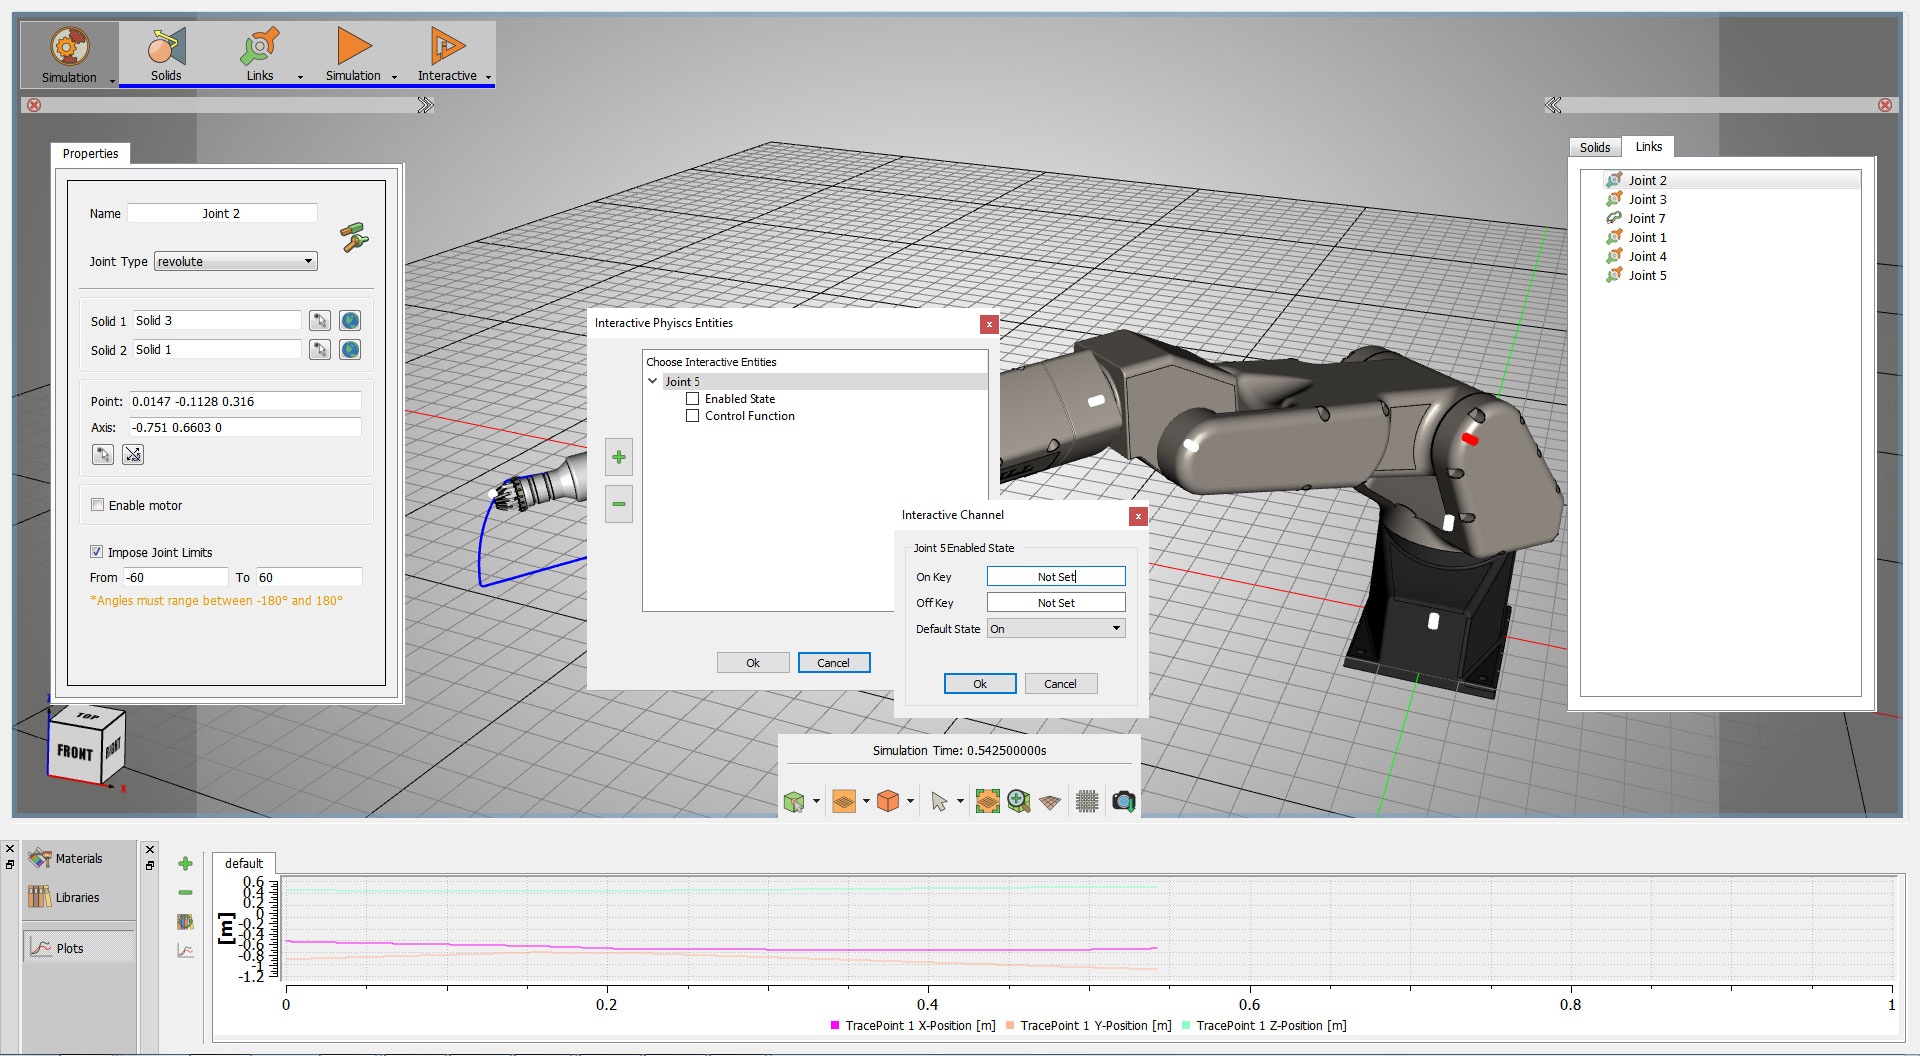
- Design Panel: A button that launches the Interactive Physics Entities dialog box.
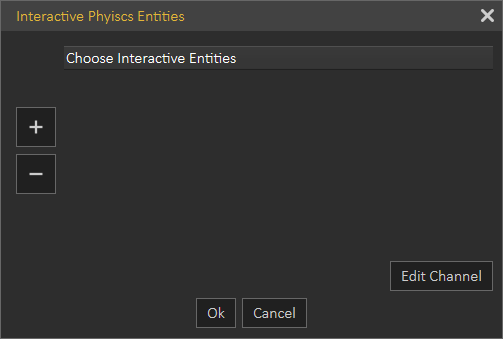
- Parameters: A button that launches the Simulation Parameters dialog box.
The Design Tab includes the following setting fields, as shown in the following image:
 Plus: It is a button with a green plus icon.
Minus: It is a button with a green minus icon.
OK: To confirm and accept settings.
Cancel: To abort the operation.
The interactive Simulation Parameter dialog box appears when the Parameters button is clicked. This dialog box is a preference pane containing multiple panels, using tabs as a navigational widget for switching among three sets of settings. The three tabs are General, Solver, and Advanced.
The Simulation Parameters dialog box is the same as the Simulation Parameters dialog box found in the Simulation Tab except for the General tab.
Interactive Simulation supports pointer devices, sliders, keyboard
ds, and joysticks.
Forward (Support Sliders, Keyboard, and Console Controller)
The Interactive mode for simulation supports game controllers in addition to the standard input peripherals.
The Xbox One Controller is the primary controller for Microsoft Xbox One console. The Xbox One Controller is powered by 2 AA batteries, however, the Micro USB port can be used to power the controller, instead of its wireless connectivity.
 (the Microsoft Xbox One controller)
Also, the Sony PS3 Controller is the primary controller for Sony Playstation 3 console. The Sony Playstation Controller features an internal built-in battery, however, the USB mini-B to USB-A cable can be used to connect the controller to the PC by wire instead of its independent Bluetooth connection.
 (Sony Playstation controller)
SimLab Composer offers direct support for the controller of Microsoft Xbox one. On the other hand, the controller of Sony PS3 requires third-party software to work properly with SimLab Composer on a PC. For more information, contact us at (support@simlab-soft.com)
Through GUI (Slider Bars)
The horizontal slider lets you set or adjust a value by moving an indicator. This control is a horizontal slider with a handle that can be moved right and left on a bar to select a value. The bar allows you to make adjustments to rotation or speed values throughout a range of pre-defined values. It allows you to alter the movement speed while being in the scene by decreasing it by dragging to the left (Slower) or increasing it by dragging it to the opposite direction (Faster).
Controller sticks are sensitive. So take advantage of this property when designing a panel of increase and decrease keys for the interactive entities for controlling control functions
Plotting Library
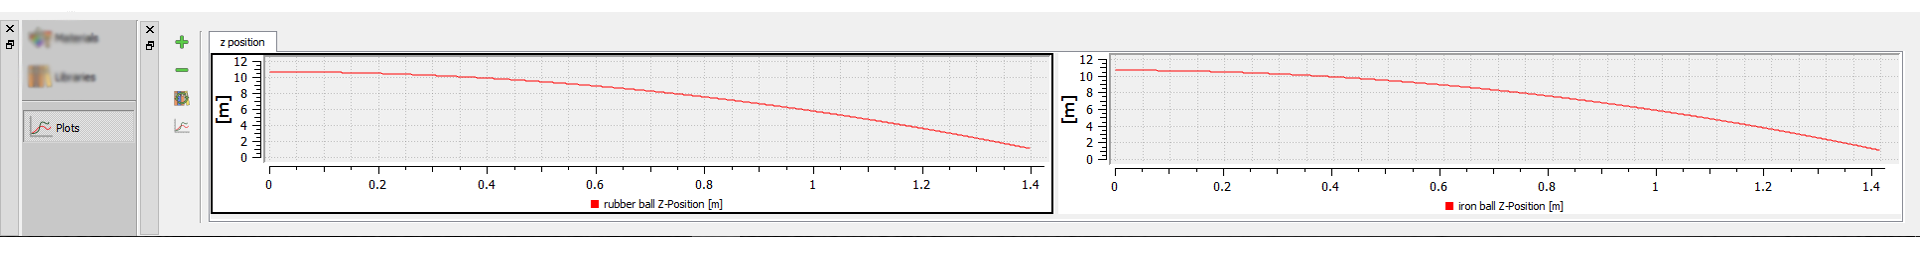
For the purpose of simulation data analysis and post-processing, the user can use this graphical technique for representing a simulation data set as a graph, showing the relationship between two or more variables. The visual presentation of different functions is very useful for users who can quickly derive an understanding as a short path to gaining insight in terms of testing assumptions, model selection, relationship identification, factor effect determination, etc. as shown in the following image a Plotting Area of two graphs.
The panel of the Plotting Library is located vertically on its left side, presenting the following four buttons:
- Add New Plot Tab: This button allows the user to add a new plot tab to Plotting Library.
- Delete Current Plot Tab: This button allows the user to delete the activated Plot Tab.
- Manage Library: The user can add multiple graphs assigned to present the desired simulation data. Four types of chart formation are available, as shown in the following image Single Plot, Dual Vertical Plots, Dual Horizontal Plots, and Four Plots.
- Manage Curves: This launches the Manage Curves dialog box (as shown in the following image) letting the user plot selected channel(s) on the desired graph area.
The Plotting Area is only associated with the Simulation Tab; it appears at the bottom of the Simulation Workbench once the Simulation Tab is activated.